Image averaging with VT
%matplotlib inline
import matplotlib.pyplot as plt
import numpy as np
import vt
from timagetk.io.image import _image_from_url
/builds/J-gEBwyb/0/mosaic/timagetk/src/timagetk/components/labelled_image.py:31: TqdmWarning: IProgress not found. Please update jupyter and ipywidgets. See https://ipywidgets.readthedocs.io/en/stable/user_install.html
  from tqdm.autonotebook import tqdm
def imshow(ax, spim, title="", cmap="gray", vmin=0, vmax=255):
    fig = ax.imshow(spim, cmap=cmap, vmin=vmin, vmax=vmax)
    ax.xaxis.tick_top()
    if title != "":
        ax.set_title(title)
    else:
        try:
            ax.set_title(f"{spim.filename}")
        except:
            pass
    return fig
Load the reference image
tmp_path = _image_from_url('https://zenodo.org/record/7149218/files/090223-p58-flo-top.lsm',
                           hash_value='5548917d3d1490200d0d56cbb31c0d35', hash_method='md5')
ref_img = vt.vtImage(tmp_path)
print(ref_img)
vtImage : {
 type    : unsigned char,
 shape  : [460, 460, 59],
 spacing : [0.200320, 0.200320, 1.000000],
 }
Create the floating image with a rigid transformation
To simplify this use case example, we create a “random” rigid transformation and apply it to the reference image to create a floating image.
r2f_trsf = vt.create_trsf(ref_img, params='-trsf-type rigid -value random -srandom 12 -angle-range 0.0 0.1')
flo_img = vt.apply_trsf(ref_img, r2f_trsf, params='-interpolation linear')
print(flo_img)
vtImage : {
 type    : unsigned char,
 shape  : [460, 460, 59],
 spacing : [0.200320, 0.200320, 1.000000],
 }
Invert the transformation to create a registered image
The previous transformation goes from the reference towards the floating image, we have to invert it to obtain the transformation that goes from the floating to the reference image. We are now in the “classical” situation where we want to register an image onto another to “fuse” them.
f2r_trsf = vt.inv_trsf(r2f_trsf)
reg_img = vt.apply_trsf(flo_img, f2r_trsf, ref=ref_img, params='-interpolation linear')
print(reg_img)
vtImage : {
 type    : unsigned char,
 shape  : [460, 460, 59],
 spacing : [0.200320, 0.200320, 1.000000],
 }
Create the masks
To average the two images, without introducing bias, we have to compute masks defining the position in space of the registered image(s).
Create the reference mask
# create an array filled with 1 shaped like the reference image
ref_arr = np.ones_like(ref_img.copy_to_array(), dtype=np.uint8)
ref_mask = vt.vtImage(ref_arr, ref_img.spacing())  # vt.vtImage do not copy the array (use the pointer)!
Check the reference mask is indeed a bolean array in VT:
np.unique(ref_mask.copy_to_array()) # allowed values are [0, 1] as it is a boolean mask
array([1], dtype=uint8)
Create the floating mask
# create an array filled with 1 shaped like the floating image
flo_arr = np.ones_like(flo_img.copy_to_array(), dtype=np.uint8)
flo_mask = vt.vtImage(flo_arr, flo_img.spacing())   # vt.vtImage do not copy the array (use the pointer)!
Check the floating mask is indeed a bolean array in VT:
np.unique(flo_mask.copy_to_array()) # allowed values are [0, 1] as it is a boolean mask
array([1], dtype=uint8)
Create the registered floating mask
reg_mask = vt.apply_trsf(flo_mask, f2r_trsf, ref=ref_img, params='-interpolation nearest')
Check the registered mask is indeed a bolean array in VT:
np.unique(reg_mask.copy_to_array()) # allowed values are [0, 1] as it is a boolean mask
array([0, 1], dtype=uint8)
Compute the average image without masks
unmasked_avimg = vt.mean_images([ref_img, reg_img], params='-mean')
Compute the average image with masks
masked_avimg = vt.mean_images([ref_img, reg_img], masks=[ref_mask, reg_mask], params='-mean')
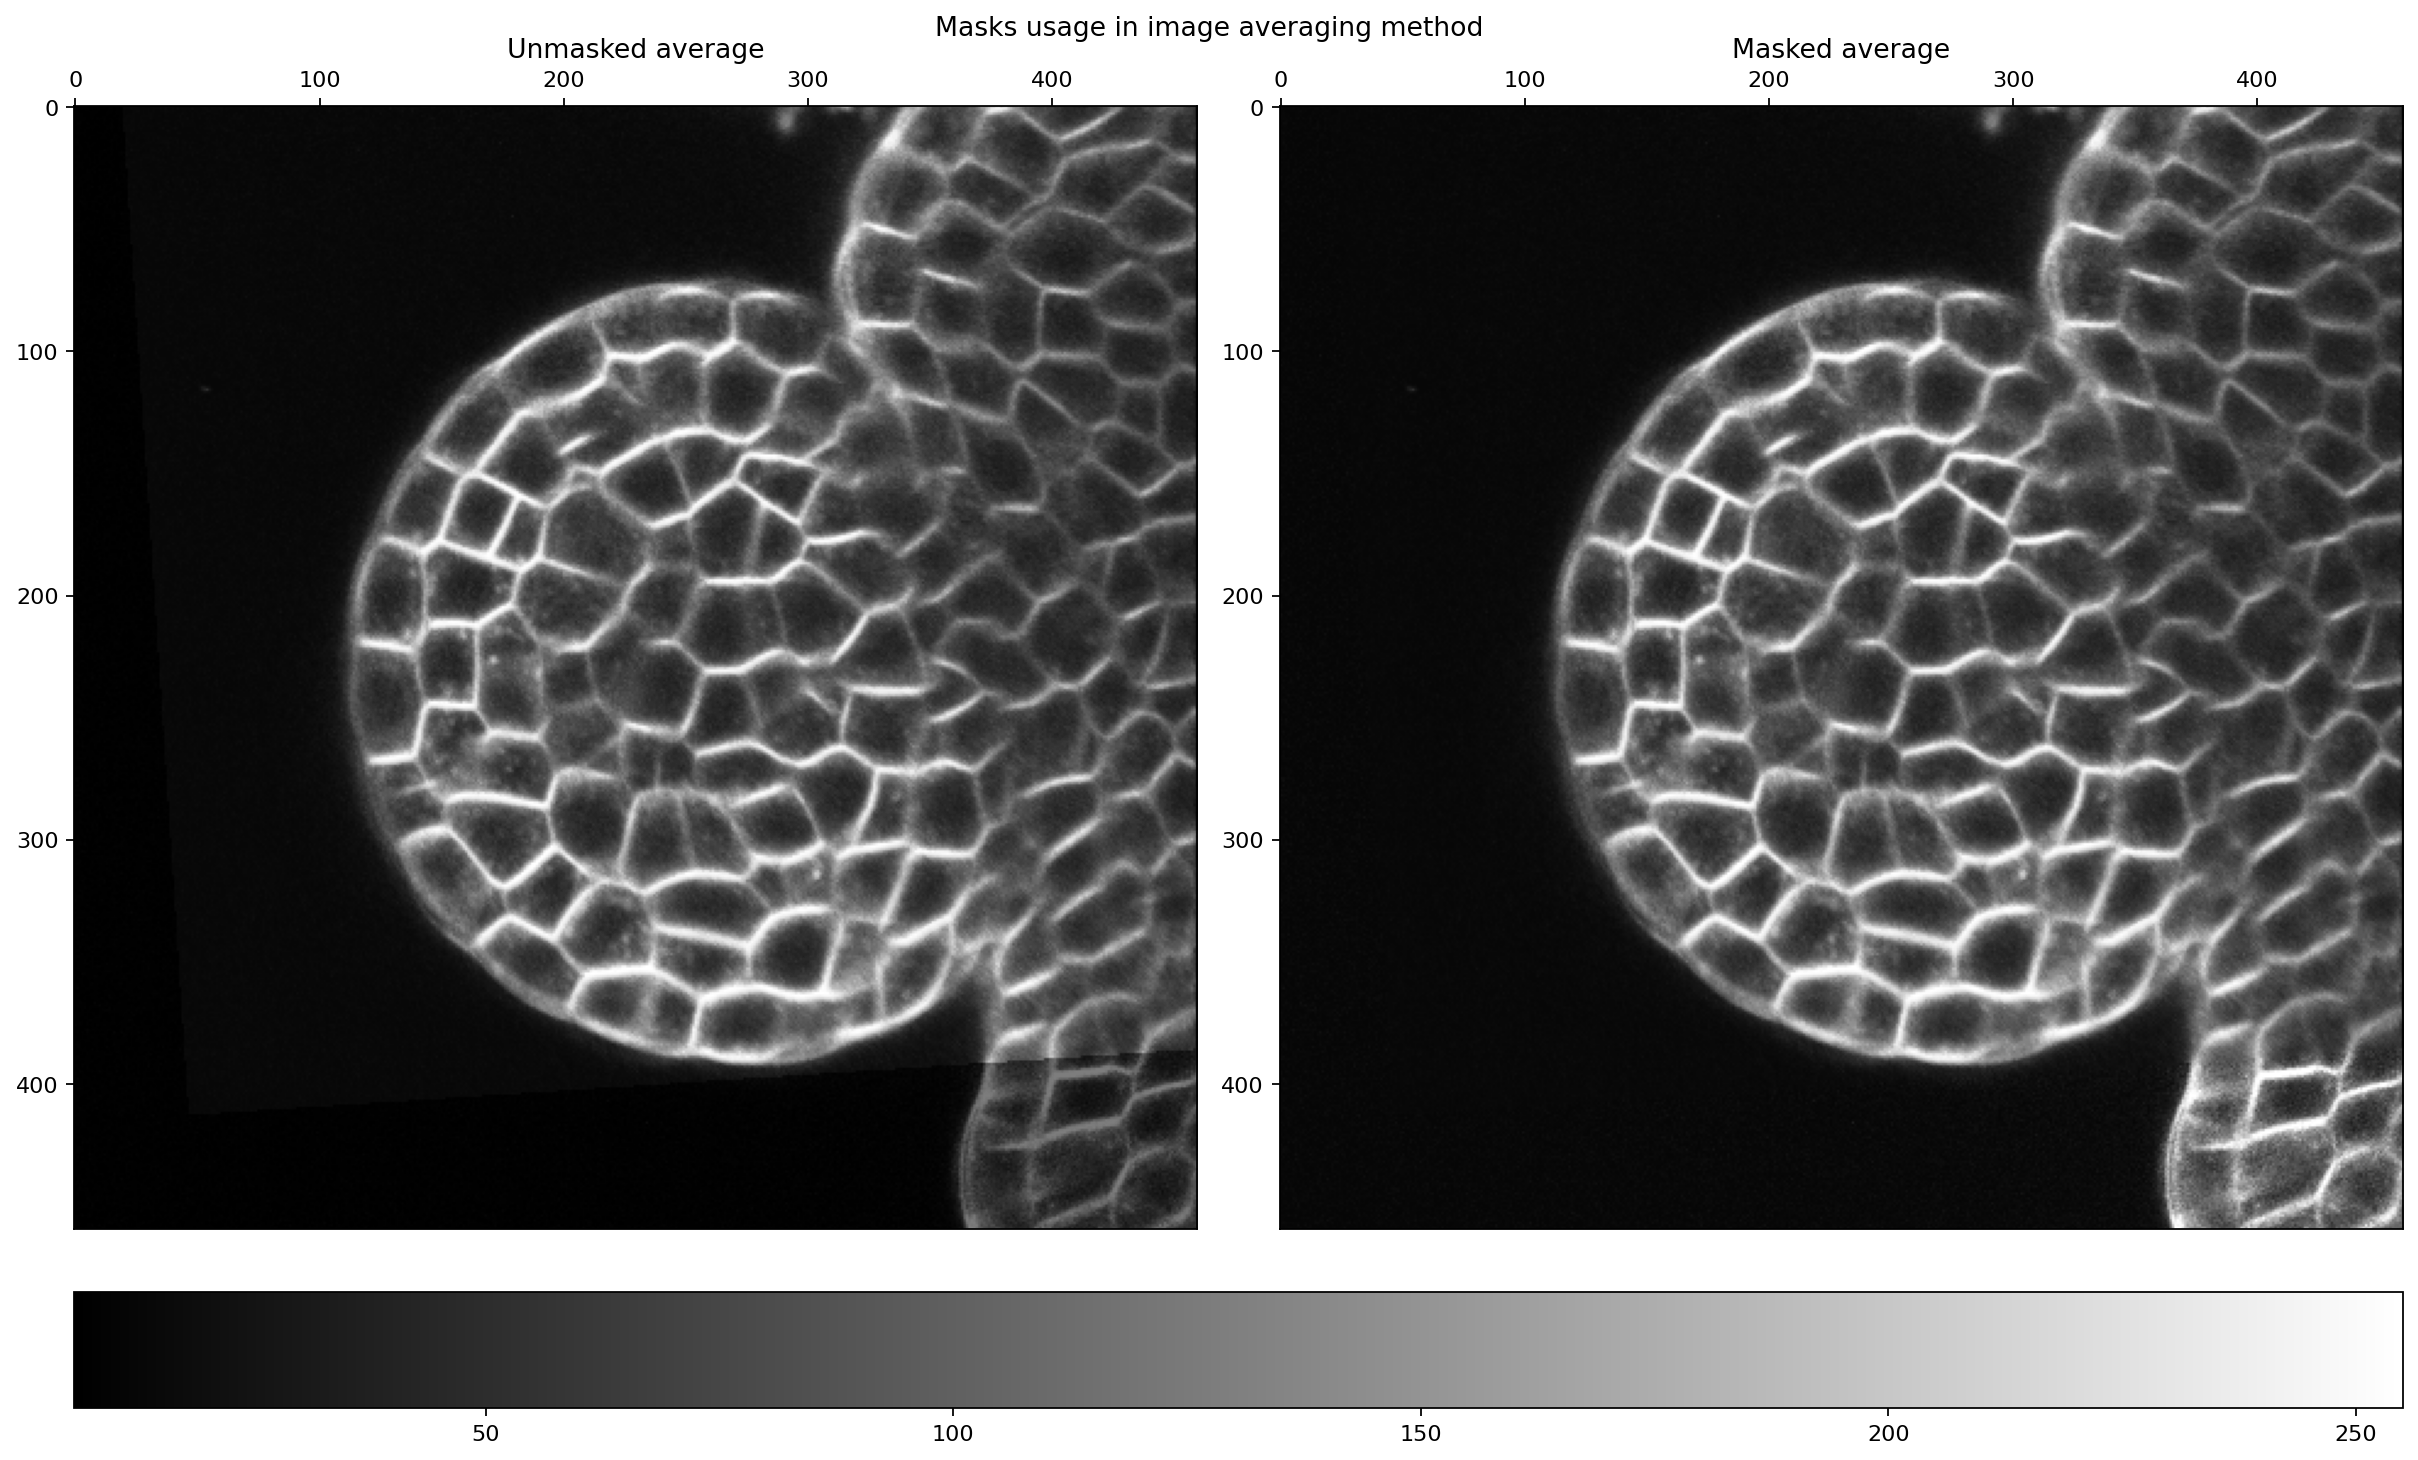
Plot the two averaged images
mid_z_sl = unmasked_avimg.shape()[2]//2
unmasked_arr = unmasked_avimg.copy_to_array()[mid_z_sl, :, :]
masked_arr = masked_avimg.copy_to_array()[mid_z_sl, :, :]
import matplotlib.gridspec as gridspec
from matplotlib import colors

fig = plt.figure(figsize=(15, 9), constrained_layout=True)
fig.set_dpi(160)
fig.suptitle("Masks usage in image averaging method")
# Create two panels
gs = gridspec.GridSpec(ncols=2, nrows=1, figure=fig)
unmask_ax = fig.add_subplot(gs[0, 0])
mask_ax = fig.add_subplot(gs[0, 1])

images = []
images.append(imshow(unmask_ax, unmasked_arr, title="Unmasked average"))
images.append(imshow(mask_ax, masked_arr, title="Masked average"))

# Find the min and max of all colors for use in setting the color scale.
vmin = min(image.get_array().min() for image in images)
vmax = max(image.get_array().max() for image in images)
norm = colors.Normalize(vmin=vmin, vmax=vmax)
for im in images:
    im.set_norm(norm)
# Add a colorbar at the bottom
fig.colorbar(images[0], ax=[unmask_ax, mask_ax], orientation='horizontal', fraction=.1)
<matplotlib.colorbar.Colorbar at 0x7fe8112fbf70>
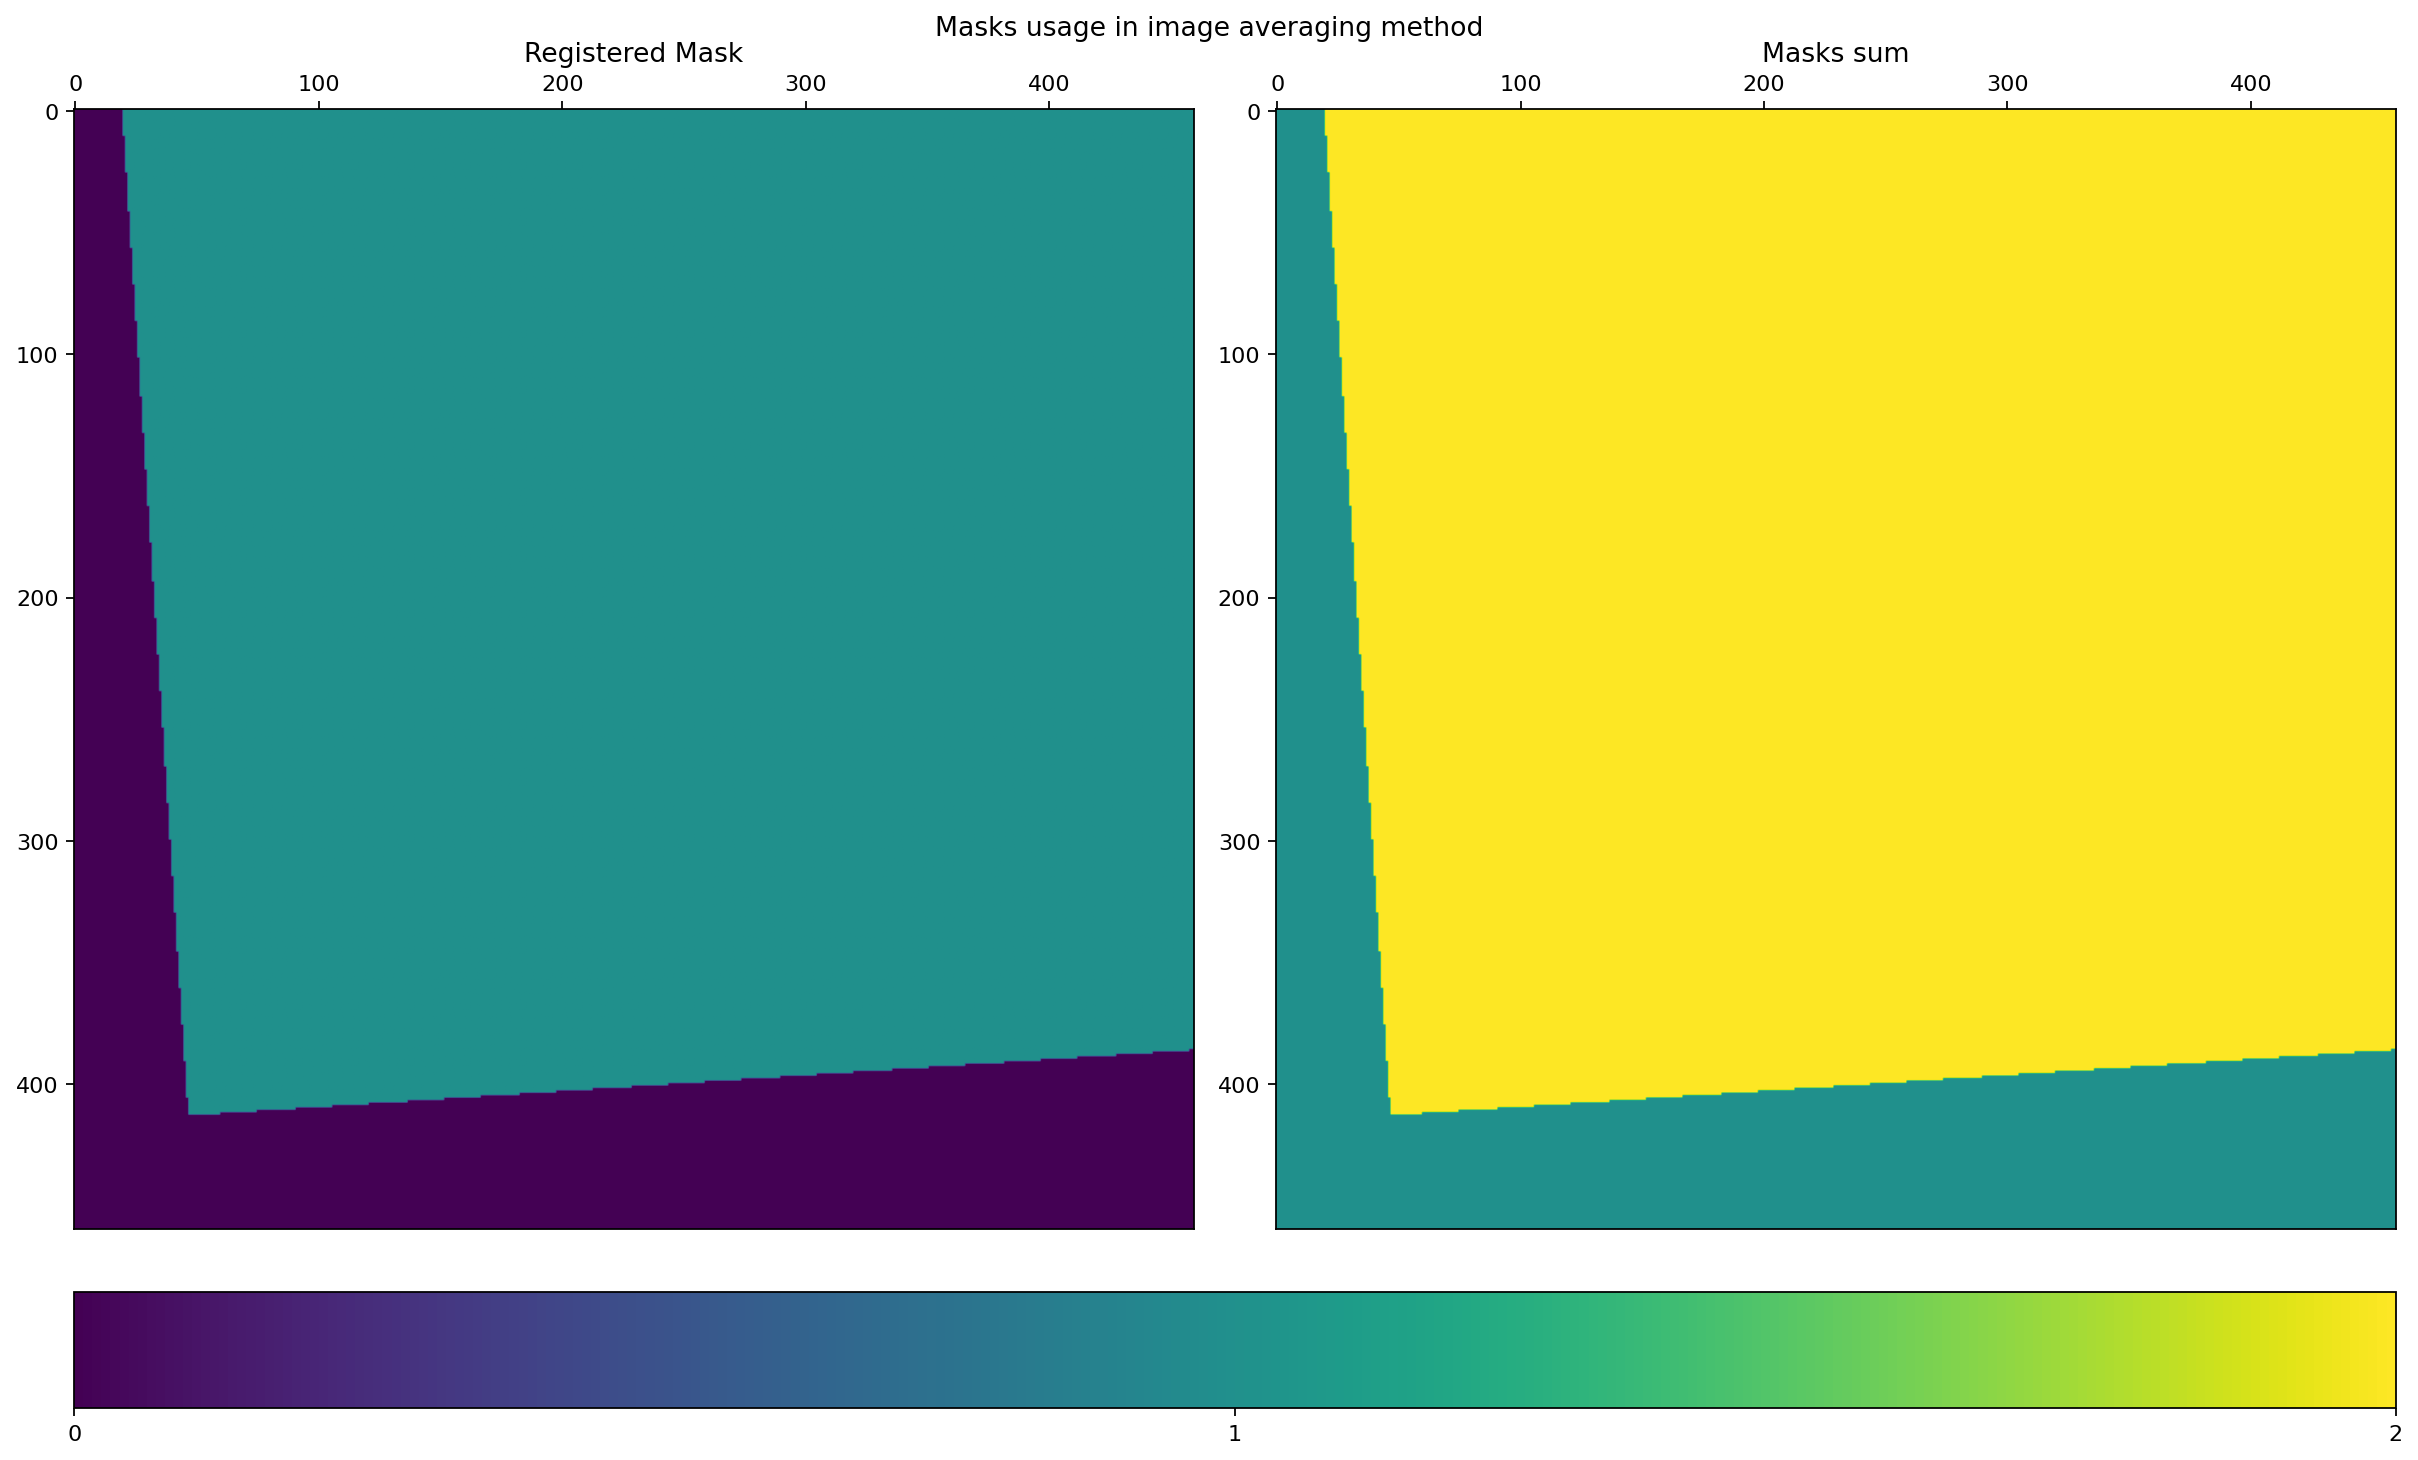
reg_mask_arr = reg_mask.copy_to_array()[mid_z_sl, :, :]
ref_mask_arr = ref_mask.copy_to_array()[mid_z_sl, :, :]
sum_arr = reg_mask_arr + ref_mask_arr
fig = plt.figure(figsize=(15, 9), constrained_layout=True)
fig.set_dpi(160)
fig.suptitle("Masks usage in image averaging method")
# Create two panels
gs = gridspec.GridSpec(ncols=2, nrows=1, figure=fig)
reg_ax = fig.add_subplot(gs[0, 0])
sum_ax = fig.add_subplot(gs[0, 1])

images = []
images.append(imshow(reg_ax, reg_mask_arr, title="Registered Mask", cmap='viridis', vmin=0, vmax=2))
images.append(imshow(sum_ax, sum_arr, title="Masks sum", cmap='viridis', vmin=0, vmax=2))

# Find the min and max of all colors for use in setting the color scale.
vmin = min(image.get_array().min() for image in images)
vmax = max(image.get_array().max() for image in images)
norm = colors.Normalize(vmin=vmin, vmax=vmax)
for im in images:
    im.set_norm(norm)
# Add a colorbar at the bottom
fig.colorbar(images[0], ax=[reg_ax, sum_ax], orientation='horizontal', fraction=.1, ticks=[0, 1, 2])
<matplotlib.colorbar.Colorbar at 0x7fe8092a61c0>